

As we reach the midpoint of the year, every major equity market is in the green in Australian-dollar terms — but the global story of the first half is one of rotation, from last year’s commodity and energy winners to semiconductors, AI and Asian tech. Here is where things stand at the halfway mark, in charts.
Key Takeaways
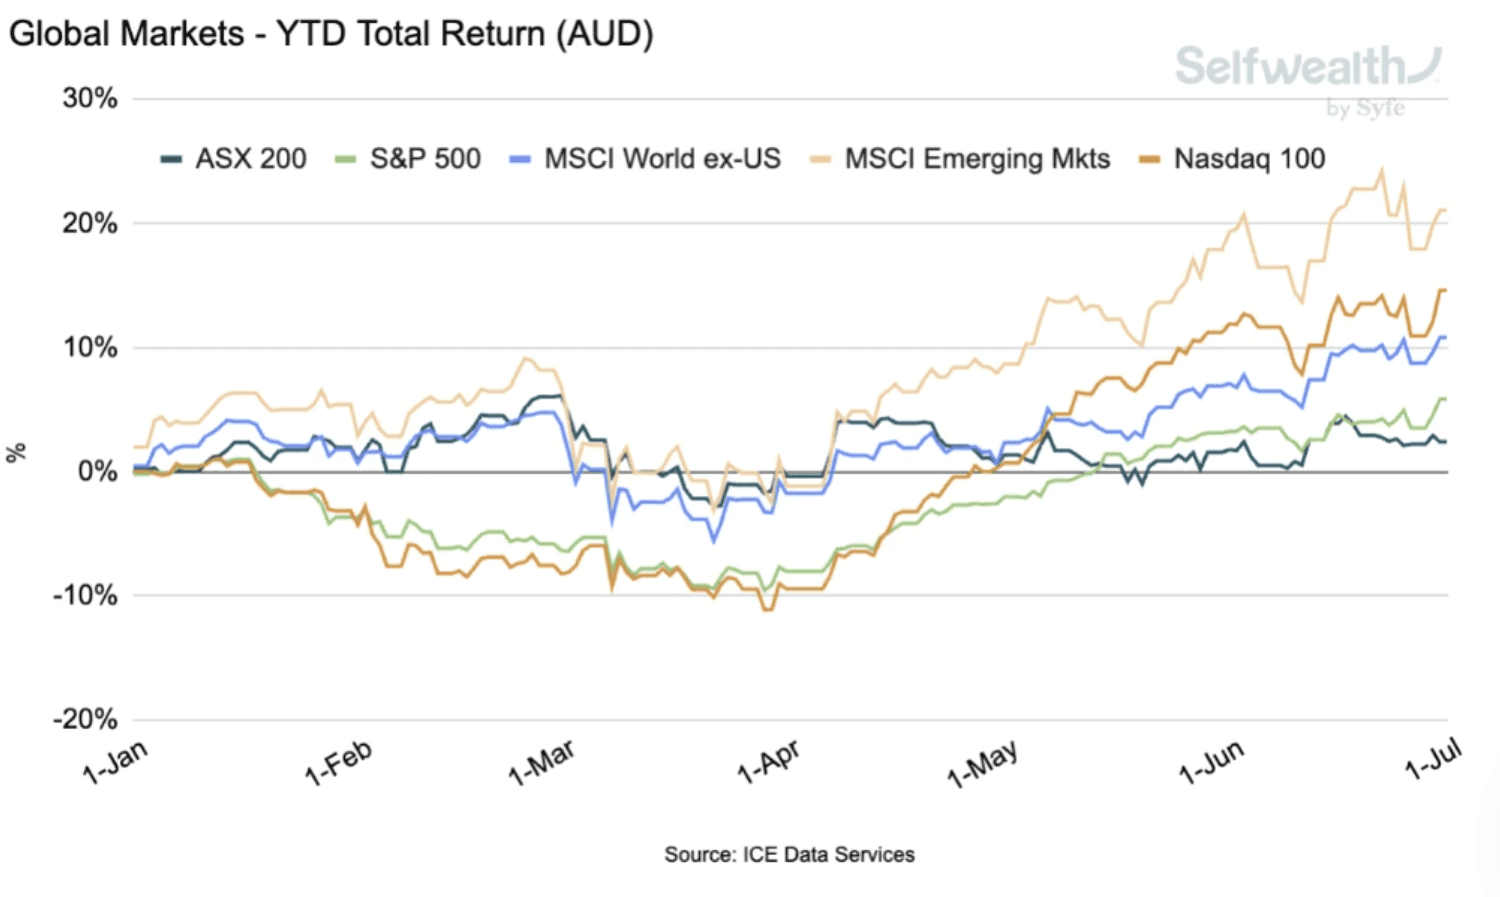
Markets are positive, but not equally. In Australian-dollar terms every major index is up year-to-date, led by emerging markets at around 20%, while the ASX 200 sits at the back of the pack near 2.4%.
Leadership has rotated. Last year’s star themes of gold miners, copper, uranium and clean-energy plays have cooled somewhat, while semiconductors, AI specific stocks and Asian tech have taken the baton.
Australia leaned defensive. Large caps beat small caps, and Consumer Staples, Energy and Materials led the market while Health Care and Info Tech lagged.
The macro backdrop tightened. Government bond yields rose across the developed world, oil spiked then fell back to pre-war levels, and the Aussie dollar firmed on RBA hikes before steadying.
Warning lights are amber, not red. The US yield curve is flattening again and credit spreads remain low — signs of an economy slowing, not stalling.
Global Equities: A Strong Recovery, Led From the East
Every major market we track is positive year-to-date in Australian-dollar terms, but the spread is wide. Emerging markets lead by a distance — up around 20% — powered by Asian markets, where the semiconductor boom and firmer commodity prices have done the heavy lifting. The tech-heavy Nasdaq 100 tells the most dramatic story. It fell the furthest during the first-quarter turmoil, down more than 10% before rebounding the hardest since. It acts as a reminder that the most aggressive indices tend to swing hardest in both directions. The S&P 500 sits around 5.8% return, while the ASX 200, the steadiest performer through the sell-off, has ended up the laggard on the rebound at roughly 2.4%. Because these returns are in Australian dollars, the stronger Aussie has quietly trimmed the offshore gains, yet global markets still comfortably outpaced the local index.
Sectors: Australian Defensives Outperform while US Tech Outperforms
Beneath the index, the Australian market had a clear tilt. Large caps outpaced small caps, extending the dominance of the big end of town, and the sector table rewarded defensives and commodities. Consumer Staples, Energy and Materials led the gains, the latter two riding the year’s commodity and oil-price strength, with heavyweights such as BHP, Rio Tinto and Woodside among the beneficiaries. At the other end, Health Care was the standout laggard, weighed down by index giant CSL, while Info Tech also fell sharply with stocks such as WiseTech seeing significant volatility. In short, it was a year to own the old economy over the new — the mirror image of the global thematic picture.

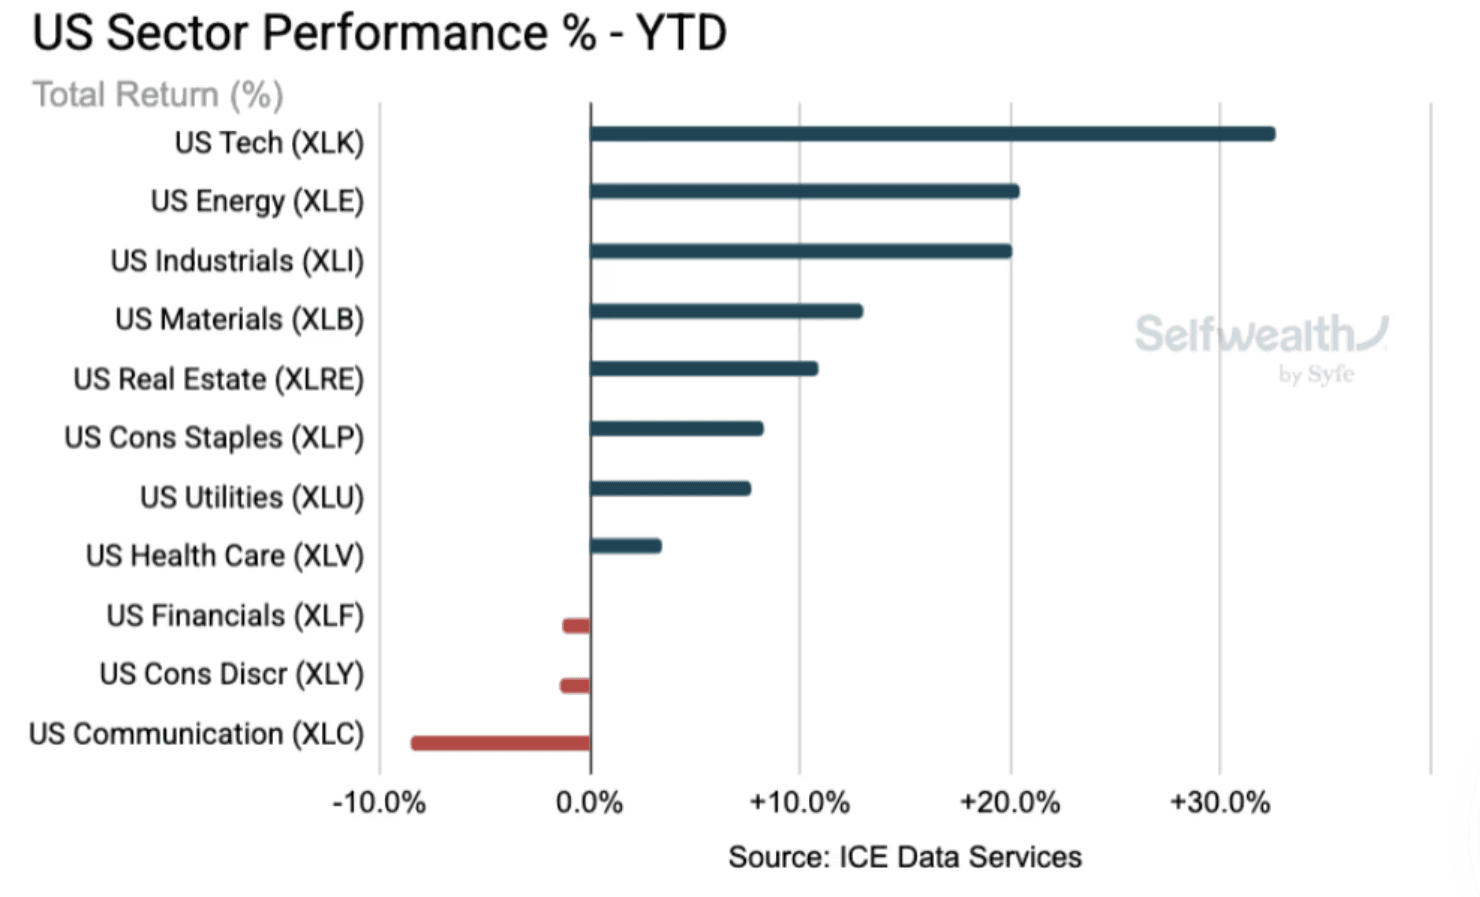
The United States tells a different story. This year brought more breadth: after years of mega-cap technology dominance, the gains have broadened out, with small-caps and cyclical sectors joining in. Technology still led decisively — up more than 30% on the AI trade — but Energy and Industrials were close behind at around 20%, and Materials also gained, a sign the rally is no longer just a handful of names. The laggards were Communication, Consumer Discretionary and Financials. The sharpest contrast with Australia is in technology: the sector that led the US market was among the worst performers on the ASX.
Rotation: From Supply Chains to Chips
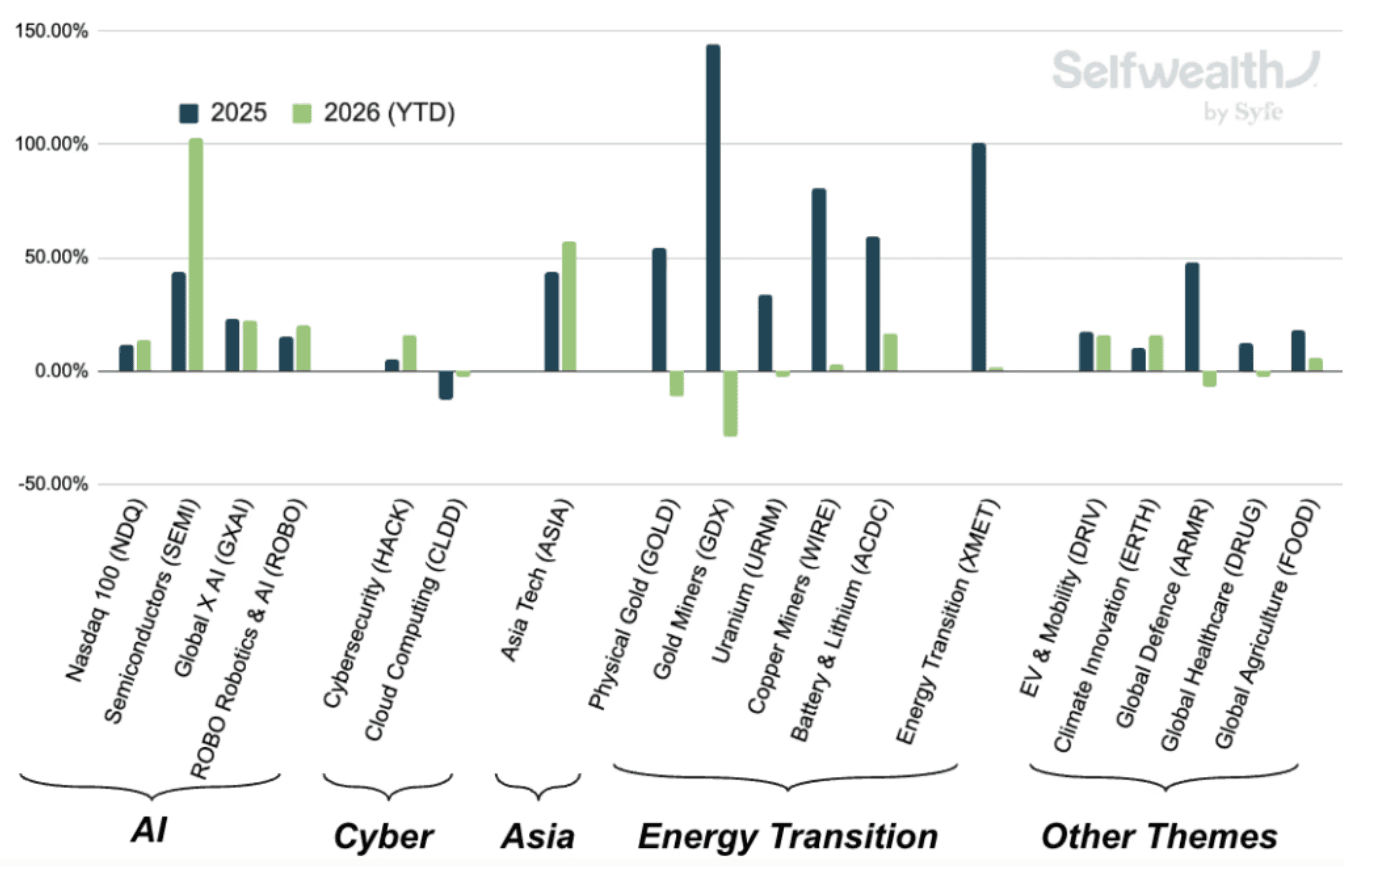
Nowhere is the shift clearer than in thematic returns. In 2025 the winners were energy-transition and commodity plays (such as gold miners, clean energy, copper and uranium). In 2026 that leadership has flipped, with semiconductors now the runaway theme and Asian technology and the broader AI complex close behind. The market's focus has moved from supply chains and energy security to chips and artificial intelligence.
The Macro Backdrop: Higher Yields, Calmer Oil, Firmer Aussie
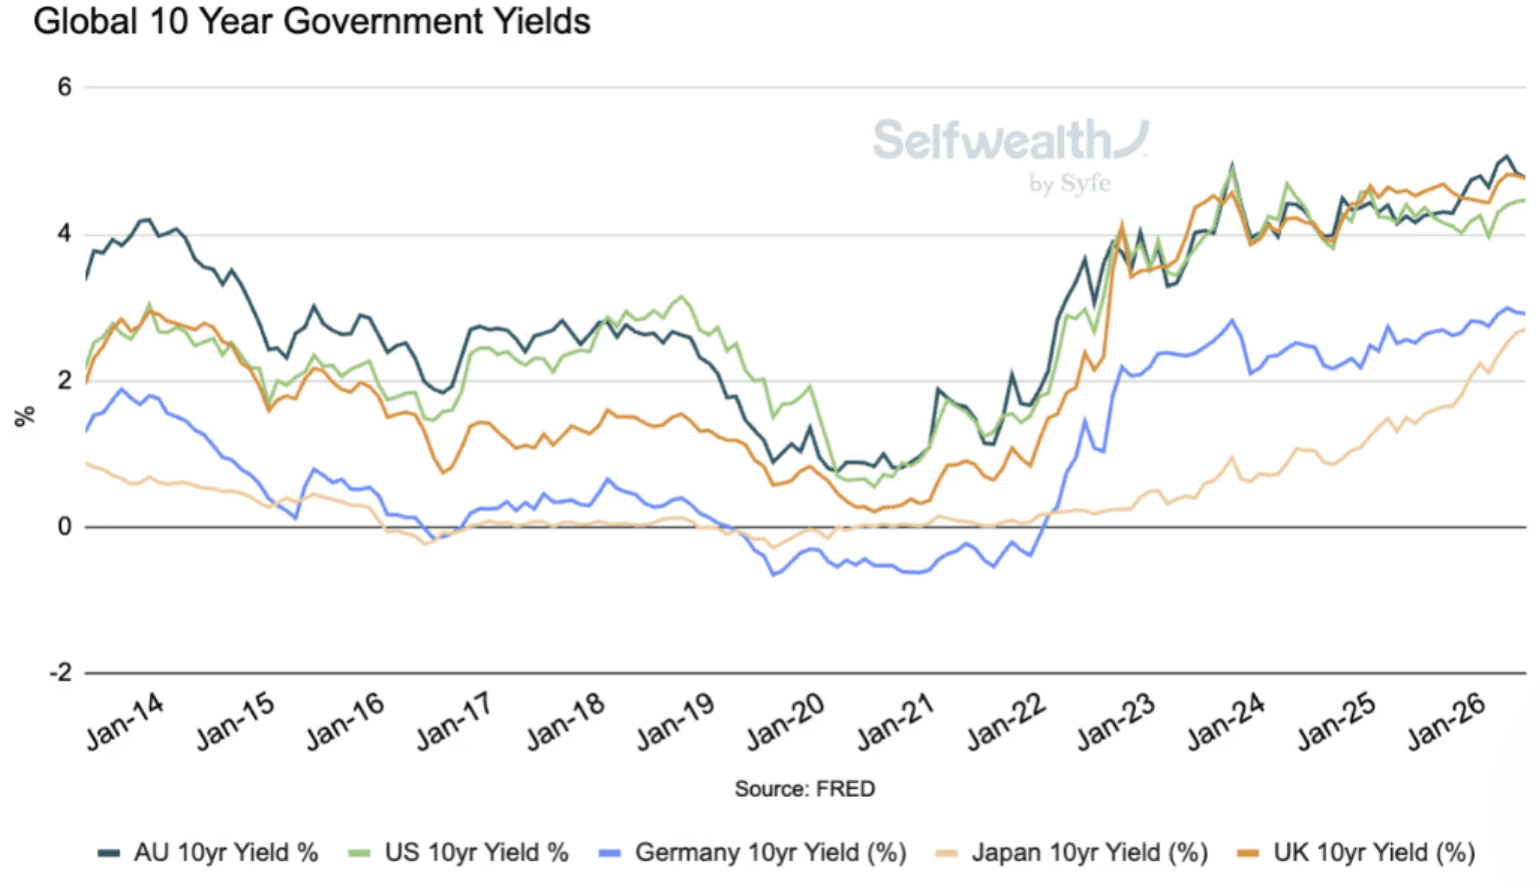
The rotation played out against a tightening macro backdrop. Government bond yields have risen across the developed world, Australia’s 10-year sits near 4.8%, among the highest in developed markets, as central banks kept policy restrictive.
Oil was the year’s wild card. The Iran conflict sent crude spiking above US$100 a barrel before it retreated back toward US$70 as the Strait of Hormuz reopened — a round trip that drove much of the first-half volatility.

And the Australian dollar climbed towards multi-year highs on the back of the RBA’s rate hikes, before pulling back toward the high-60s as markets began to price the prospect of US hikes too.

With yields high and growth slowing, one classic recession signal to watch is the gap between 10-year and 2-year US government bond yields: when short-term yields climb above long-term ones (an ‘inverted’ curve), a downturn has tended to follow. Right now that gap is positive but narrowing again, pointing to an economy that is tightening rather than one in danger.
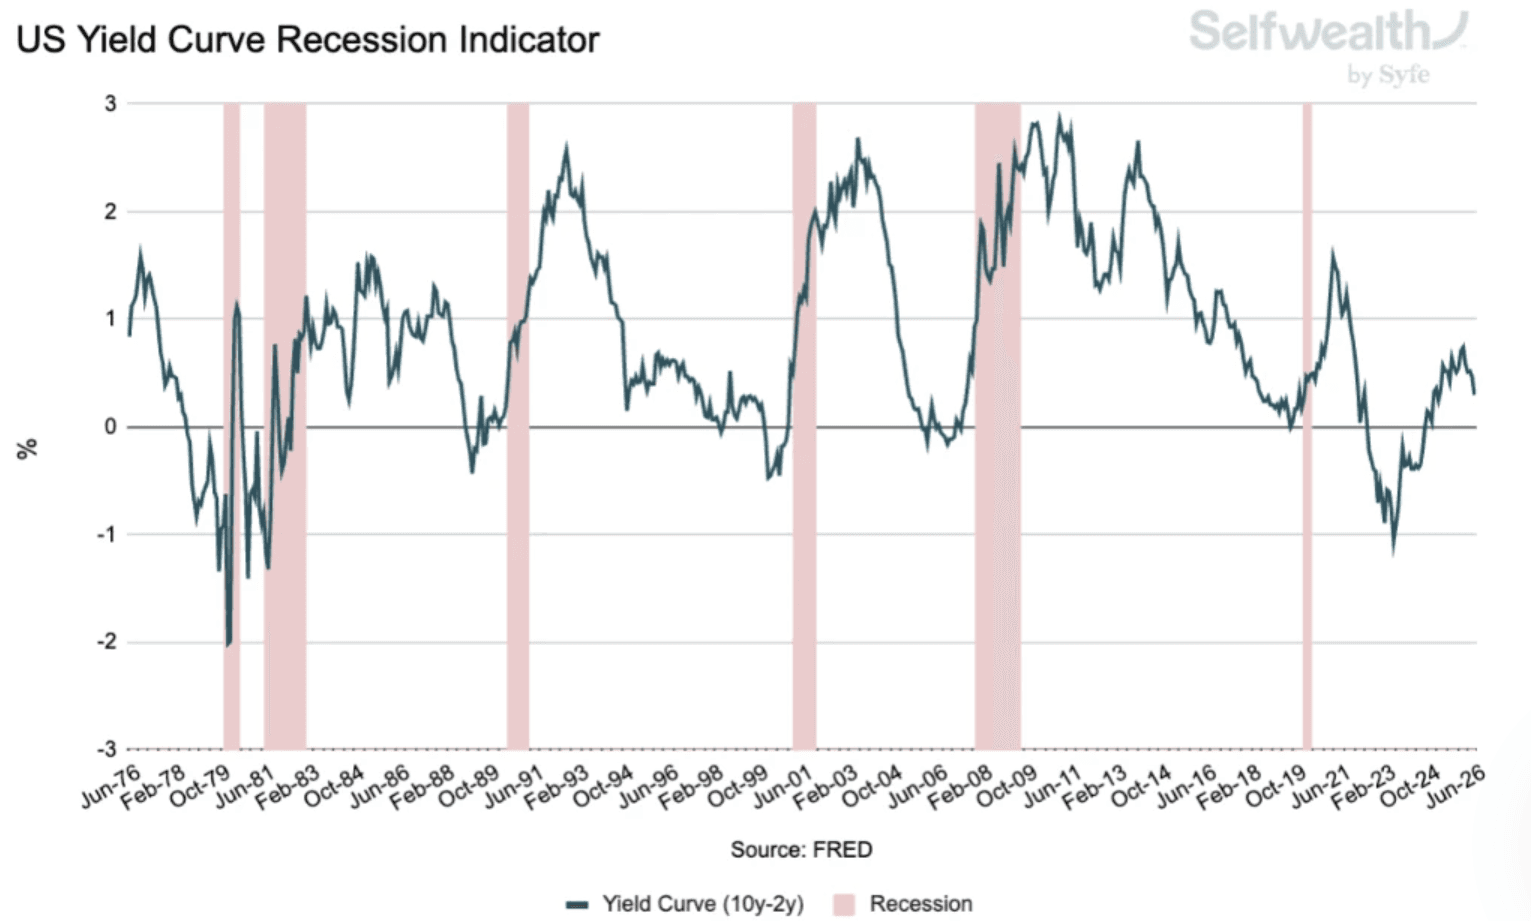
Reinforcing that, US credit spreads which measure the extra return investors demand to hold riskier corporate debt over government bonds remain relatively low, suggesting markets are not yet braced for stress. The signals are amber, not red.
What It Means for Investors
Income has become more attractive. Higher yields mean income-generating assets are historically more attractive.
A softer-but-growing economy could still favour risk assets. Slowing growth that stops short of recession poses a historically reasonable backdrop for shares, though with interest rates high, more of the return may come from income than from rapid capital gains.
Expect more volatility and dispersion. The sharp rotation and wide gap between winners and losers we saw in the first half is likely to persist, which rewards staying diversified.
Looking Ahead
The second half will hinge on whether inflation keeps cooling enough to let central banks stop hiking, whether the Middle East truce holds, and whether the AI and semiconductor trade can sustain its extraordinary run.
What We're Keeping an Eye on
US jobs (June) — early July: A key gauge of whether the US economy is cooling enough to keep the Fed on hold, or strong enough to justify the hikes markets are starting to price.
US PMI surveys — early July: The timeliest read on US manufacturing and services activity; a soft print would add to the evidence of a gradual slowdown.
Iran ceasefire & the Strait of Hormuz — ongoing: Whether the latest pause holds and the Strait fully reopens; any relapse would send oil — and the war premium — straight back up.
Important disclaimer: SelfWealth Pty Ltd ABN 52 154 324 428 (“Selfwealth”) (AFSL 421789). The information contained on this website is general in nature and does not take into account your personal situation. You should consider whether the information is appropriate to your needs, and where appropriate, seek professional advice from a financial adviser and/or accountant. Taxation, legal and other matters referred to on this website are of a general nature only and should not be relied upon in place of appropriate professional advice. You should obtain the relevant Product Disclosure Statement for any product mentioned and consider its contents before making any decision.
Most Recent Articles


